MBA in Data Science & Analytics is a two-year, full-time master degree course designed for graduate students.
Business intelligence helps organizations succeed by providing more affordable and unique products and services than their competitors.
Data analytics is an important tool for improving corporate performance and developing effective strategies.
Every organization relies on data from various sources such as sales, marketing, operations, logistics, and customer feedback to make business decisions.
Computer technology plays an important role in storing and processing business data for analytics and business intelligence.
An MBA in Data Science & Business Analytics helps management professionals successfully lead an organization.
This course covers various topics such as:
- Business Intelligence, Analytics & Data Science
- Data, Statistical Modeling & Visualization
- Data Warehousing
- Data Mining
- Predictive Analytics
- Prescriptive Analytics
- Big Data
- Trends in Data Analytics
- Privacy Issue & Legality in Data Science
Business Intelligence, Analytics & Data Science
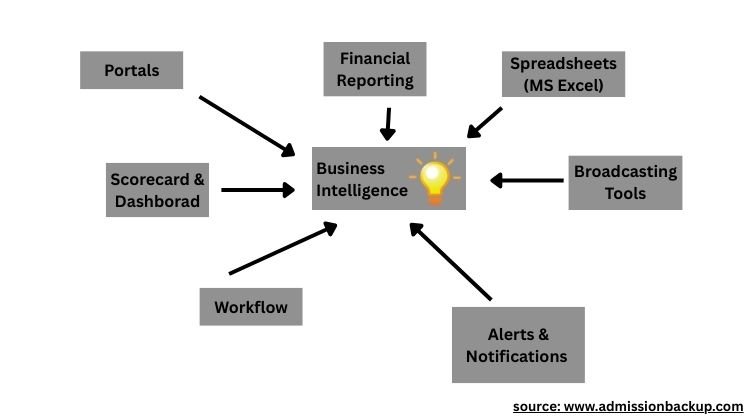
Business Intelligence is the process of finding valuable information in large volumes of data to make important decisions.
In the modern context, it is known as Analytics and Data Science.
Business Intelligence combines a wide variety of tools that gather data and present it in a meaningful way, such as computer applications, information systems, reports, dashboards, scorecards, and spreadsheets.
An organization generates multiple transcational data at discrete time intervals.
Modern Business Intelligence tools capture this transactional data in online analytical processing systems.
Examples of online analytical processing systems include:
- Enterprise Resource Planning (ERP)
- Customer Relationship Management (CRM)
- Supply Chain Management (SCM)
- Learning Management System (LMS)
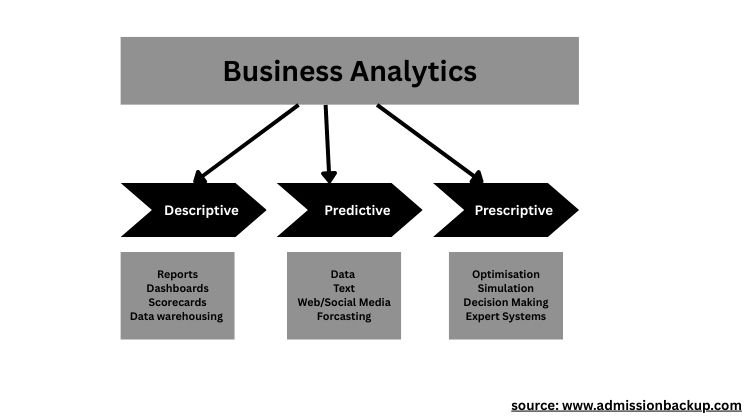
Business Analytics
Business Analytics is done in three stages known as:
- Descriptive
- Predictive
- Prescriptive
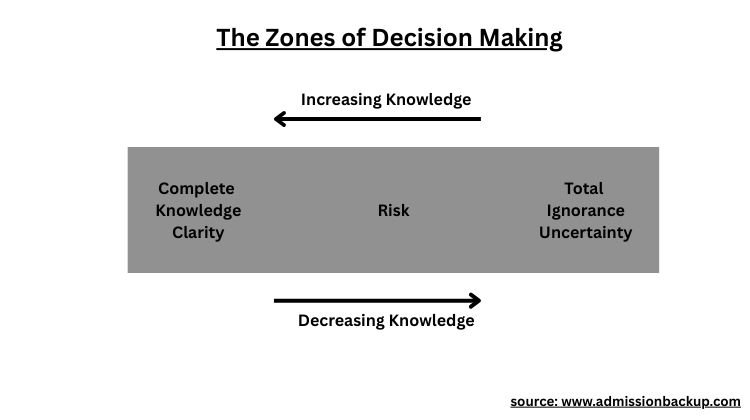
Based on the data and information analysis, managers can analyze present and past business growth.
They can predict future growth or downfall of the business and determine what steps can be taken to minimize the risks associated with the business.
Business Analytics is also known as Data Science.
Data science is the analysis of data generated during business processes.
Data can be classified as structured (numerical values, text, images, videos) and unstructured data obtained from sources such as sensors, web streams, etc.
Data, Statistical Modeling & Visualization
Data is valuable information that can be stored and processed to obtain knowledge helpful in decision-making for various business processes.
Generally, data consists of numerical values, text, videos, audio, and images.
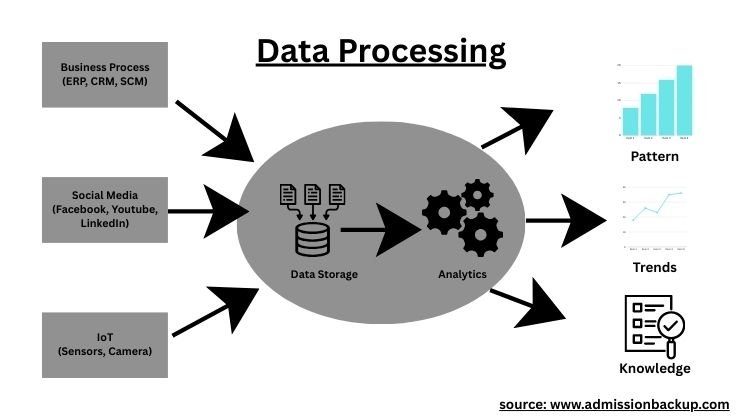
With the advent of computers, businesses gather huge amounts of data from web clicks, social media, and IoT devices such as cameras and sensors.
Computers can store, protect, and process vast amounts of data used in business intelligence.
Data processing is the process of converting real-world data into well-refined forms for analytics.
Data accuracy can be determined by important factors such as:
- Data Source Reliability
- Data Content Accuracy
- Data Accessibility
- Data Security & Data Privacy
- Data Richness (Comprehensiveness)
- Data Consistency
- Data Timeliness (Up to date)
Statistics:
Statistics is a collection of mathematical techniques used to characterize and interpret numerical data.
There are two types of statistical modeling:
- Descriptive Statistics
- Inferential Statistics
Descriptive Statistics describes the basic characteristics of numerical data using mathematical formulas such as average, ratio, median, range, variance, standard deviation, etc.
Inferential Statistics involves drawing various conclusions and making predictions from a sample of data.
For example: weather report prediction, annual rainfall prediction, etc.
Information obtained from statistical data is used to prepare reports for public or business decision-making.
Business reporting is used for communication to convey information to all stakeholders of the organization.
Reports can be text, audio, or video-based information for specific time periods, events, or various other subjects.
Visualization:
Visualization is the presentation of information through charts, graphs, maps, and information dashboards.
It is the visual representation of data, such as a map of a geographical location.
Modern computer applications used for data visualization include Tableau, Microsoft Power BI, etc.
Data Warehousing
A data warehouse is a repository of data generated by an organization and used to support business decisions.
Modern data warehouses are located in data centers.
Using advanced technology, computers can process terabytes of data.
Organizations mostly use personal computers for business operations.
Over time, islands of data are generated across all verticals, which must be stored and processed for predictive analytics.
Technology companies that offer data warehousing services include:
- Teradata
- IBM
- SAP
- EMC
- Microsoft
- Oracle
- Amazon Web Services
A major purpose of a data warehouse is to integrate data from multiple systems (Sales, Marketing, Finance, and Human Resources) for analysis.
Data Mining
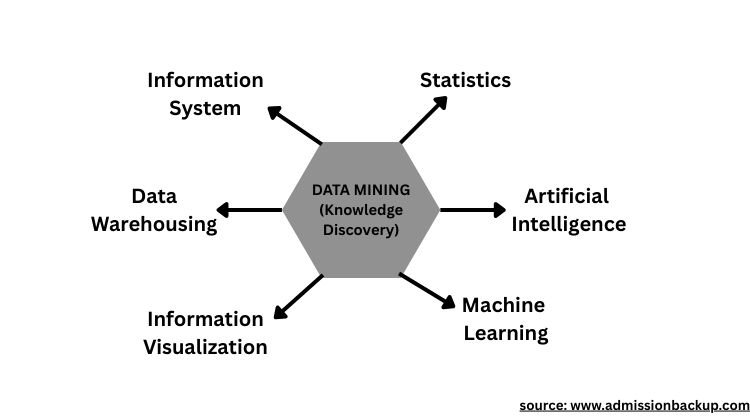
Data Mining is the process of extracting information or knowledge from a large amount of data that an organization collects, organizes, and stores.
Data Mining supports a wide range of applications such as Machine Learning, Artificial Intelligence, Statistics, Information Visualization, Data Warehousing, and Management Science.
Data Mining is the process of segmenting or naturally grouping information based on the common attributes present in the data.
Popular software tools for data mining include IBM Watson, Apache Spark, and programming languages such as R and Python.
Data Mining is a popular tool for a wide range of business processes such as:
- Customer Relationship Management: Understanding the needs and wants of customers
- Banking: Predicting loan defaulters.
- Retailing & Logistics: Predicting sales volume
- Manufacturing: Predicting machine failure
- Securities Trading: Forecasting stock fluctuations
- Insurance: Forecasting claim amounts
- Computer: Detecting spam content
- Defence: Forecasting the cost of military equipment
- Travel Industry: Predicting sales of different services
- Healthcare: Forecasting demand at different service locations
- Medicine: Predicting the success rate of survivability
- Entertainment: Forecasting the best programs for prime time
- Security: Discovering crime patterns
Predictive Analytics
Predictive Analytics is helpful in the analysis of unstructured data such as web content and text files (PDF files, Word documents).
Classification, Clustering, and Association help create a bag of words used by machines to identify spam and legitimate content.
Sentiment analysis is useful in various decision-making processes.
- Classification: Hindi, English, Chinese
- Clustering: Nudity, Vulgarity, Authentic
- Association: Spam, Legitimate
This process is known as Natural Language Processing (NLP).
NLP is a subfield of Artificial Intelligence and Machine Learning.
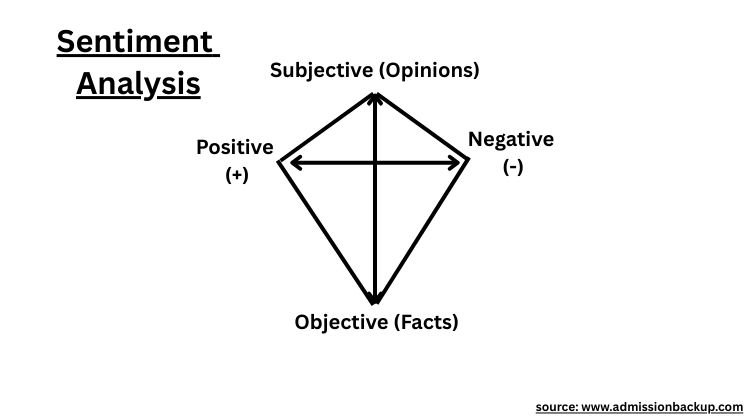
Sentiment Analysis plays an important role in text analysis available from a wide range of data sources such as the web, social media, product reviews, chat, newspapers, etc.
Data Scientists use polarity identification techniques for text analysis by comparing it against a catalog of words known as a lexicon.
Polarity Identification for Text Analysis:
- Positive and Negative
- Objective (Fact-Based) and Subjective (Opinion-Based)
Prescriptive Analytics
Predictive Analytics is the process of choosing the best product or service available in the marketplace.
It helps organizations choose the most suitable service provider for business requirements such as Human Resources, Operations, Logistics, Marketing, Production, etc.
Decision Support Systems rely on various variables such as:
- Time Consumption
- Cost
- Affordability
- Quality
- Experience
Decision variables may vary based on various goals and objectives such as financial investment, marketing, manufacturing, accounting, logistics, and staffing.
Forecasting helps in predicting the demand for suitable products or services, cost analysis, etc.
Spreadsheets such as Microsoft Excel have database management capabilities and are widely used for statistical forecasting.
Simulation or artificial modeling is also a form of predictive analytics.
It helps in performing various experiments with software-based models to analyze the results for decision-making.
Big Data
The term Big Data is used for the sheer volume of data, which can be measured in terabytes, petabytes, exabytes, and zettabytes.
Big Data can be defined by volume, variety, and velocity.
- Volume: Size of data (1 TB)
- Variety: Source (Client Devices, IoT, RFID tags)
- Velocity: Data processing (parallel processing or in-memory processing)
Hadoop is an open-source project under the Apache Software Foundation that allows parallel processing of data.
It is commonly used for Big Data analytics by large organizations that annually generate terabytes of data or more.
Trends in Data Analytics
Businesses rely upon past and present data for effective decision-making.
With quality data, we can solve a vast number of business-related problems.
Collecting, storing, and processing are the three stages of Business Intelligence.
Big Data helps in making better predictions, though processing Big Data has various challenges such as knowledge of advanced technology, cost, and experienced data scientists.
Data Scientist is one of the hottest jobs of the 21st century.
Issues of Legality, Privacy, & Ethics
Typically, insights generated from public data are considered safer than those generated by IoT sensors and Artificial Intelligence.
There are various legal issues related to data generated by computers.
Privacy issues, such as collecting information about individuals without their consent, are a major concern associated with Data Mining.
Strict privacy laws protect individual privacy over the Internet, and organizations must comply with them while rendering their products and services.
MBA in Data Science & Analytics Admission Process
Any student who wishes to pursue an MBA in Data Science & Analytics must fulfill the eligibility criteria:
- Must have completed graduation.
- Must have appeared in any of the entrance exams such as CAT, CMAT, XAT, etc.
Students can apply to colleges based on the marks obtained in the competitive entrance exam for MBA admission.
Top Business Schools in Bangalore that offer MBA in Data Science & Analytics courses are:
- Indian Institute of Management, Bangalore
- Symbiosis University
- Christ University
- St. Joseph Institute of Management
- Xavier Institute of Management & Entrepreneurship
- Jain University
- MS Ramaiah Institute of Management
- Kristu Jayanti University
- Welingkar Institute of Management
- Presidency University
- Alliance University
- PES University
- ISBR Business School
- Jagdish Sheth School of Business
- Acharya Business School
- International Institute of Business Studies
- S-Vyasa University
- GIBS Business School
- Indus Business Academy
- Ramaiah University of Applied Sciences
- Reva University
- Dayananda Sagar University
Job Opportunities for Data Science Professionals
Data Scientists are hired by a wide range of organizations such as Internet companies, investment firms, the sports industry, the entertainment industry, healthcare, manufacturing, insurance firms, tax accounting firms, energy sectors, and government enterprises.
There are 4.5 million job roles for Data Scientists, of which only one-third are filled due to a lack of trained professionals.
Data Scientists earn a six-figure income (in Indian rupees) or even higher based on their experience.
The average salary package for junior Data Scientists varies from 6 lakh to 9 lakh INR CTC.
The highest salary package for experienced Data Scientists varies from 15 lakh to 22 lakh INR CTC.
Top companies that hire MBA graduates for the role of Data Scientist include:
- Microsoft
- Amazon
- IBM
- Teradata
- JP Morgan
- Morgan Stanley
- Goldman Sachs
- Deloitte
This field is very vast, as it requires soft skills, domain expertise, and managerial skills to become a Data Scientist.
FAQs about MBA in Data Science & Analytics
The syllabus for MBA in Data Science & Analytics includes Managerial Science, Management Information Systems (MIS), Business Analytics, Scripting Languages (PHP or Python), Relational Databases and SQL, Analytics tools such as R, and Computing tools (Apache Hadoop).
Data Science professionals earn a six-figure income (in US dollars), which may increase based on their experience and capability to analyze Big Data.
Some of the reputed colleges are the Indian Institutes of Management (IIMs), Symbiosis University, Manipal University, BITS Pilani, TAPMI, SP Jain, etc.
Students must appear in common entrance tests such as CAT, XAT, and CMAT and obtain a rank. Based on the marks obtained, you can apply to various colleges for the further admission process. Admission Backup helps you join the best business schools based on your entrance exam scores. We help you secure direct admission to top private MBA colleges.
Conclusion:
Business Performance Management is a Key Performance Indicator (KPI) used to monitor, measure, and manage business growth and performance.
An MBA in Data Science & Business Analytics allows managers to ensure effective and efficient business performance management.
Data processing is essential for the success of any organization.
It is helpful in extracting valuable information required for good decision-making.
Cutting-edge technologies such as Natural Language Processing and Neural Networks improve the decision-making capability of businesses and organizations.
Data Scientists turn Big Data into big value, delivering products that delight users and insights that help in decision-making.
Graduates from engineering or technical backgrounds can choose an MBA in Data Science for better job opportunities as Data Scientists.
This course is designed to equip students with advanced technologies for future managerial roles.
For career consultation, please contact our helpline at +91 8546881677.